Plugin Repo
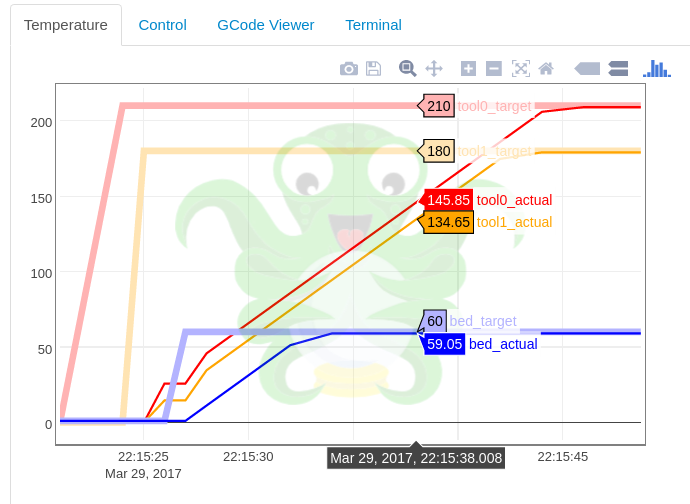
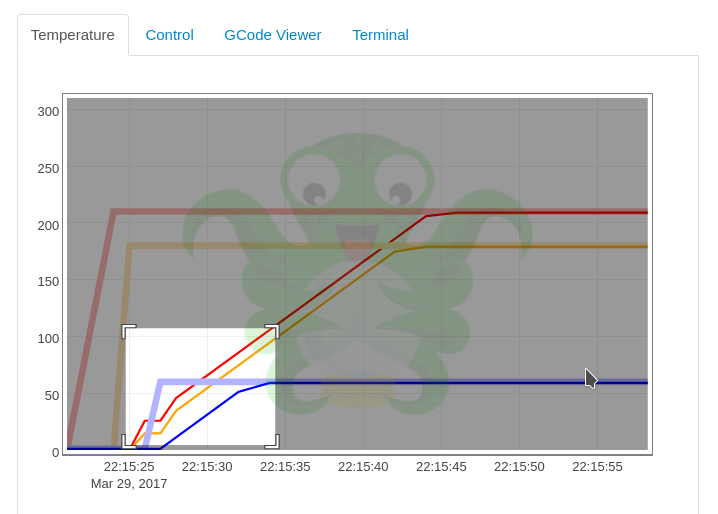
Replaces the temperature graph with an interactive and zoomable one
This plugin adds some features to the temperature graph :
- exact values on hover
- zooming
- panning
- export
Usage :
- hover over the graph to show date and temperatures under the cursor
- drag to zoom
- shift + drag to pan
- double click to reset axes / autoscale
Pictures