 Plugin Repo
Show the temperatures of everything in the navbar/topbar of OctoPrint. It can display the hotend, chamber, all tools/hotends and also add an unlimited number of your own “top widgets” for example showing cpu temperature, fan speed - well anything that is a number (for now) that you can get back from running a command.
Top Temp
A plugin that will show you the temperatures in the navbar/topbar of OctoPrint. It can display the hotend, chamber, all tools/hotends and also add an unlimited number of your own “top widgets” for example showing cpu temperature, fan speed - well anything that is a number (for now) that you can get back from running a command.
It can all be customized and setup to fit your needs:
- Add a small background graph to show the history directly in the topbar
- Customizable “widgets” can have different run intervals
- 4 different custom types:
- Command: Run a local command on the RPI/PC and get the result back
- GCode sent: Get data from the GCode being sent. For example: Cooling fan speed, Feedrate, Z-height
- From printer: Get data based on data from the printer. For example:M105 commands with ambient and probe temp if you printer support its
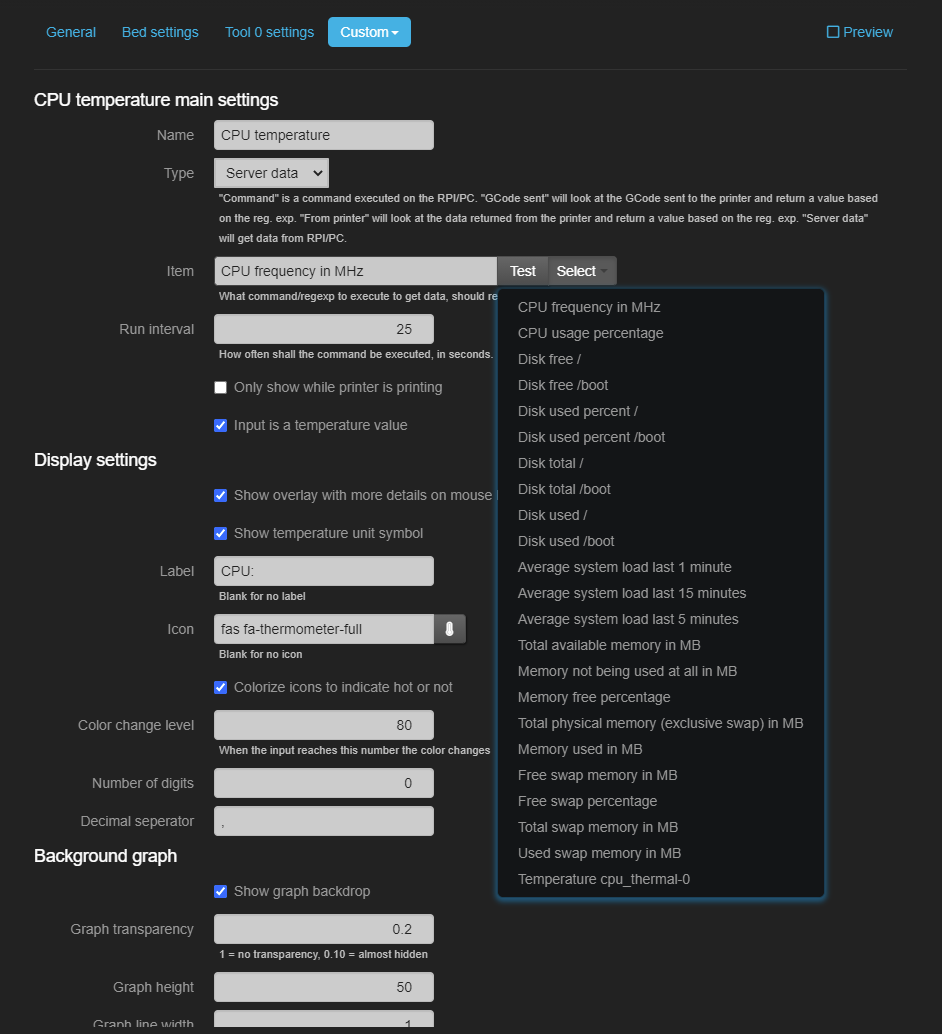
- Server data: CPU percentage/frequency, load average, memory total/avail/used/free, swap, disk free/total/used, all sensors (temperatures and fans), battery timeleft/percentage
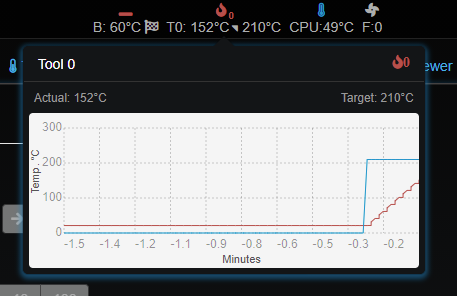
- Popover graphs with full history with a quick clance
- Show temperature in Celsius or Fahrenheit
- Hide printer temperatures when not operational
- Set padding between each and outer margin
- Sort the order of the “widgets”
- Show target temperature
- Show target progress aka getting hotter or colder
- Show temperature symbol
- Set label or no label to be shown
- Icon or no icon to be shown
- Colorize icons to indicate when hot
- Number of digits to display
- Set background graph transparency, height, line width and color
- Realtime preview
Planned features
- Small font options
- Max width per “widget”
Setup
Install via the bundled Plugin Manager or manually using this URL: https://github.com/LazeMSS/OctoPrint-TopTemp/archive/main.zip
Configuration
Install and read the onscreen information - it should be pretty self-explanatory else play with it :)
Custom commands
The custom commands allow you to run any OS command by entering a command into the “Command” field. There is a Test button that will run the command and let you validate the returned data. At the moment the returned data has to be a number (float or integer) and will be fixed If the plugin has detected any known ways of finding interesting data on startup this will be shown in Predefined dropdown button. At the moment it only looks for known CPU temperature, but if you know of any good generic ways to display interesting data then post it here https://github.com/LazeMSS/OctoPrint-TopTemp/issues
3RD Party software
-
http://gionkunz.github.io/chartist-js/index.html This plugin uses the wonderful CHARTIST.JS library to make the svg graphs
-
https://psutil.readthedocs.io/en/latest/# The included psutil in octoprint is used and gives all the important cpu/disk etc. data.
Pictures