 Plugin Repo
Display temperature data in a plotly js graph.
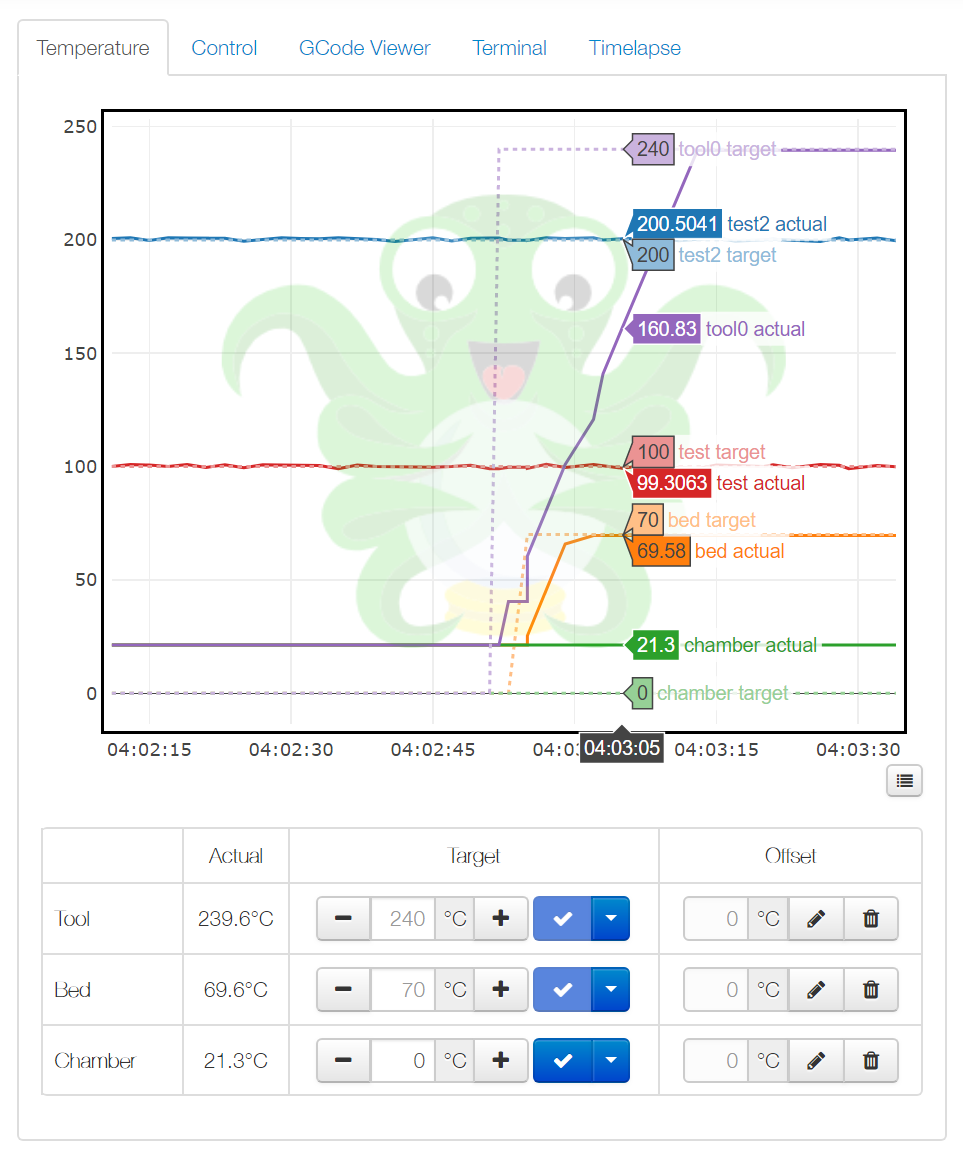
OctoPrint-PlotlyTempGraph
This plugin replaces the default temperature tab of OctoPrint with a plotly.js graph that incorporates other data supplied by the return of plugin’s octoprint-comm-protocol-temperatures-received callbacks. Useful for other plugins to inject their own data into the temperature graph (ie. Enclosure Plugin Sensor Data).
Get Help
If you experience issues with this plugin or need assistance please use the issue tracker at the plugin’s Homepage linked on the right.
Additional Plugins
Check out my other plugins here
Support My Efforts
I, jneilliii, programmed this plugin for fun and do my best effort to support those that have issues with it, please return the favor and leave me a tip or become a Patron if you find this plugin helpful and want me to continue future development.


No paypal.me? Send funds via PayPal to jneilliii@gmail.com